___ this diagram with that one and you will find the production rose ___ 20%.
A.Compared, to B.Compared, by
C.Comparing, to D.Compare; by
科目:高中英语 来源:重庆市酉阳一中2010届高三下学期3月月考 题型:阅读理解
C.
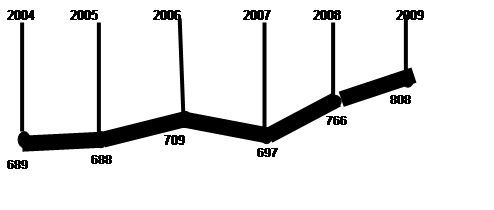
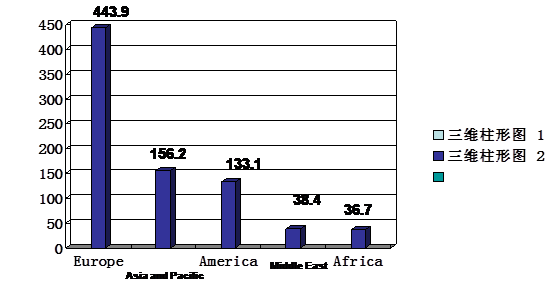
Global Travel (International tourist arrivals in millions)

2009 statistics
64. According to the statistics, which destination attracted the most tourists in 2009?
A. Middle East B. America C. Asia and Pacific D. Europe
65. During which interval(间隔)was there the greatest increase of global travel?
A. Between 2005-2006. B. Between 2007-2008
C. Between 2006-2007 D. Between 2008-2009.
66. Which is true about the diagram?
A. The diagram shows that there will be a steady increase of global travel over the next few years.
B. Global travel suffered a slight drop every year from 2004 to 2007.
C. The number of tourists increased by 21 million from 2005 to 2006.
D. Tourists from Europe made up half of the total in 2009.
67. This diagram is mainly about ____________________.
A. different destinations for tourists B. statistics of global travel from 2004 to 2009
C. the prediction of international tourists arrivals. D. the tendency(趋势)of global travel
查看答案和解析>>
科目:高中英语 来源:辽宁省开原高中2009-2010学年度高二下学期第一次月考英语试题 题型:阅读理解
第三部分 阅读理解(共两节,满分40分)
第一节(共15题;每小题2分,满分30分)
阅读下列短文,从每题所给的四个选项(A,B,C,和D)中选出最佳选项,并在答题卡上将该项涂黑。
A
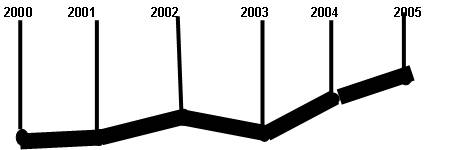
Global travel
International tourist arrivals in millions
2005 statistics
56. According to the statistics(统计), which destination attracted the most tourists in 2005?
A. Middle East B. America C. Asia and Pacific D. Europe
57. During which interval(间隔)was there the greatest increase of global travel?
A. Between 2001-2002. B. Between 2003-2004
C. Between 2002-2003 D.Between 2004-2005.
58. Which is true about the diagram(图表)?
A. The diagram shows that there will be a steady (稳固的) increase of global travel over the next few years.
B. Global travel suffered a slight drop(下降) every year from 2000 to 2003.
C. The number of tourists increased by 21 million from 2001 to 2002.
D. Tourists from Europe made up half of the total in 2005.
59. This diagram is mainly about ____________________.
A. different destinations for tourists
B. statistics of global travel from 2000 to 2005
C. the prediction(预测) of international tourists arrivals.
D. the tendency(趋势) of global travel
查看答案和解析>>
科目:高中英语 来源: 题型:
C.
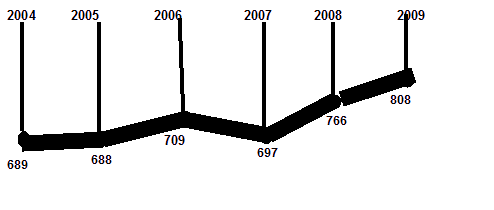
Global Travel (International tourist arrivals in millions)


2009 statistics

64. According to the statistics, which destination attracted the most tourists in 2009?
A. Middle East B. America C. Asia and Pacific D. Europe
65. During which interval(间隔)was there the greatest increase of global travel?
A. Between 2005-2006. B. Between 2007-2008
C. Between 2006-2007 D. Between 2008-2009.
66. Which is true about the diagram?
A. The diagram shows that there will be a steady increase of global travel over the next few years.
B. Global travel suffered a slight drop every year from 2004 to 2007.
C. The number of tourists increased by 21 million from 2005 to 2006.
D. Tourists from Europe made up half of the total in 2009.
67. This diagram is mainly about ____________________.
A. different destinations for tourists B. statistics of global travel from 2004 to 2009
C. the prediction of international tourists arrivals. D. the tendency(趋势)of global travel
查看答案和解析>>
科目:高中英语 来源: 题型:阅读理解
第三部分 阅读理解(共两节,满分40分)
第一节(共15题;每小题2分,满分30分)
阅读下列短文,从每题所给的四个选项(A,B,C,和D)中选出最佳选项,并在答题卡上将该项涂黑。
A
Global travel
International tourist arrivals in millions

2005 statistics

56. According to the statistics(统计), which destination attracted the most tourists in 2005?
A. Middle East B. America C. Asia and Pacific D. Europe
57. During which interval(间隔)was there the greatest increase of global travel?
A. Between 2001-2002. B. Between 2003-2004
C. Between 2002-2003 D.Between 2004-2005.
58. Which is true about the diagram(图表)?
A. The diagram shows that there will be a steady (稳固的) increase of global travel over the next few years.
B. Global travel suffered a slight drop(下降) every year from 2000 to 2003.
C. The number of tourists increased by 21 million from 2001 to 2002.
D. Tourists from Europe made up half of the total in 2005.
59. This diagram is mainly about ____________________.
A. different destinations for tourists
B. statistics of global travel from 2000 to 2005
C. the prediction(预测) of international tourists arrivals.
D. the tendency(趋势) of global travel
查看答案和解析>>
湖北省互联网违法和不良信息举报平台 | 网上有害信息举报专区 | 电信诈骗举报专区 | 涉历史虚无主义有害信息举报专区 | 涉企侵权举报专区
违法和不良信息举报电话:027-86699610 举报邮箱:58377363@163.com