题目列表(包括答案和解析)
补全对话
A:Does Mary 1ndline model planes?
B:No.she doesn't.She 2ndline books.
A:Does Sue 3ndline music?
B:Yes,she does.She also 4ndline badminton.
A:Do Sue and Mary 5ndline letters?
B:No,they don't.They 6 e-mails.
A:Do you 7 football matches on TV?
B:No,I don't.I 8ndline films.
A:Your mum says we shouldn't 9ndline too much TV or films.You should 10 to her.She's always fight!
书面表达
看图仿照例子写出Rose的活动
Model: Rose often does her homework in the evening.
Last evening she didn't do her homework.
Now she is doing her homework.

(1) On Sundays__________________________________________
_______________________________________________________
_______________________________________________________

(2) On Saturdays________________________________________
_______________________________________________________
_______________________________________________________
(3) In the evening______________________________________
_______________________________________________________
_______________________________________________________
| |||||||||||||||||||||||||||||||||||||||||||||||||||||||||||||||||||||||||||||||||||||||||||||||||||||||||||||||||||||||||||||||||||||||||||||||||||||||||||||||||||||||||||||||||||||||||||||||||||||||||||||||||||||
It shook, rattled (嗄嗄作响), and groaned (呻吟). It wasn't pretty. It looked like a black box sitting on high, skinny wheels. But it could go anywhere, and it was cheap.
What was it? It was Henry Ford's Model-T ca-better known as the Tin Lizzie. This car was the most popular of all for nearly 20 years. It changed the American way of life forever.
Model T's were sold as fast as they were made. Eleven thousand were sold in 1908. They cost $850 each. Of course, you can't buy a new car for $850 any longer. The prices of new cars keep changing.
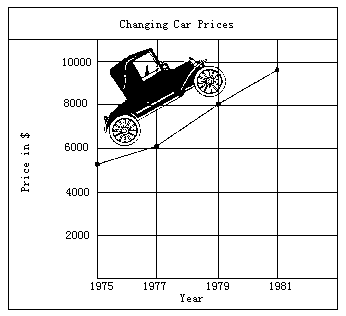
The line graph below shows how the average prices of American cars have been changing.

A line graph shows how something has changed. This kind of graph uses a simple line to show changes. If the line goes up, that means things have gone up in some way. If the line goes down, then something has gone down.
Suppose you want to find the average price of cars for 1977. Find 1977 at the bottom of the graph. Find the dot over the year. Then find the price across from the dot.
Use the line graph to answer the questions below.
1.What was the average price of a car in 1979?
[ ]
2.What does the line graph show about car prices?
[ ]
3.In what year did cars cost more than $4000 but less than $6000?
[ ]
4.Suppose you were looking for a new car in 1981. What would the average price have been?
[ ]
5.How did the average price of cars change from 1977 to 1979?
[ ]
| |||||||||||||||||||||||||||||||||||||||||||||||||||||||||||||||||||||||||||||||||||||||||||||||||||||||||||||||||||||||||||||||||||||||||||||||||||||||||||||||||||||||||||||||||||||||||||||||||||||||||||||||||||||
湖北省互联网违法和不良信息举报平台 | 网上有害信息举报专区 | 电信诈骗举报专区 | 涉历史虚无主义有害信息举报专区 | 涉企侵权举报专区
违法和不良信息举报电话:027-86699610 举报邮箱:58377363@163.com