Last year,some groups of students in their community(社区)made a survey about “How do people spend their free time?” The following diagrams show some results of it.
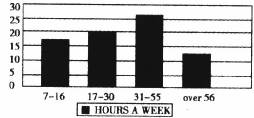
Diagram(1):Hours for people of different ages who surf the Internet in week.

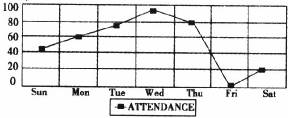
Diagram(2):Different days people go to the library.(library attendance.)

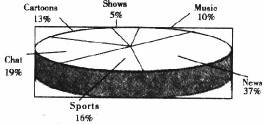
Diagram(3):Different programs people like.

根据上面三个图表内容,选择正确答案。
1.People aged ______ spend the most time surfing the Internet every week.
A.7~16 B.17—30 C.31—-55 D.over 56
2.The word “attendance” in Diagram(2)means “ ______ in the library”。
A.the hours people spend B.the number of people
C.the number of books D.the days people spend
3.On weekends,______ people go to the library every week.
A.over sixty B.less than sixty
C.about twenty D.more than one hundred
4.Which of the following is true according to the diagrams?
A.The fewest people like watching music.
B.Sports are the most people’s favorite program.
C.People seldom go to the library on weekdays.
D.Half of the people like watching news or cartoons.
5.The three diagrams show us the results of a survey about ______.
A.what people do every day
B.how people spend their free time
C.people’s different lifestyles
D.people’s different habits
科目:初中英语 来源: 题型:
Last year,some groups of students in their community(社区)made a survey about “How do people spend their free time?” The following diagrams show some results of it.
Diagram(1):Hours for people of different ages who surf the Internet in week.
Diagram(2):Different days people go to the library.(library attendance.)
Diagram(3):Different programs people like.
根据上面三个图表内容,选择正确答案。
1.People aged ______ spend the most time surfing the Internet every week.
A.7~16 B.17—30 C.31—-55 D.over 56
2.The word “attendance” in Diagram(2)means “ ______ in the library”。
A.the hours people spend B.the number of people
C.the number of books D.the days people spend
3.On weekends,______ people go to the library every week.
A.over sixty B.less than sixty
C.about twenty D.more than one hundred
4.Which of the following is true according to the diagrams?
A.The fewest people like watching music.
B.Sports are the most people’s favorite program.
C.People seldom go to the library on weekdays.
D.Half of the people like watching news or cartoons.
5.The three diagrams show us the results of a survey about ______.
A.what people do every day
B.how people spend their free time
C.people’s different lifestyles
D.people’s different habits
湖北省互联网违法和不良信息举报平台 | 网上有害信息举报专区 | 电信诈骗举报专区 | 涉历史虚无主义有害信息举报专区 | 涉企侵权举报专区
违法和不良信息举报电话:027-86699610 举报邮箱:58377363@163.com